Waterblitz shows healthy Dodder Water Quality but with some points of concern
DCU Water Institute have published the Waterblitz report, giving a great snapshot of the health of Ireland’s freshwaters. This is a compilation of all of the results and information that over 800 participants gathered on Ireland rivers, lakes and streams over the weekend of the 7th – 10th May 2021.
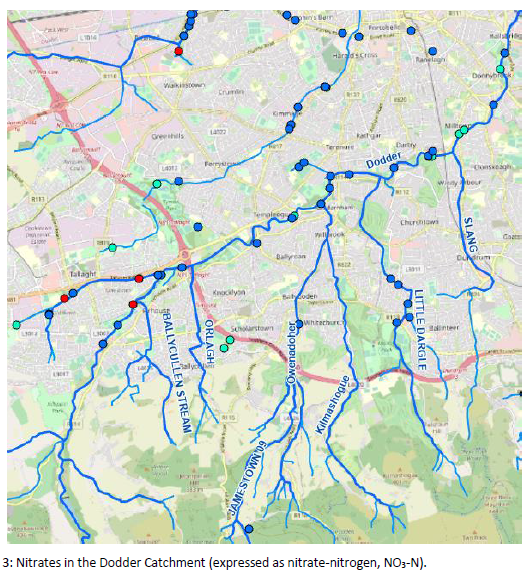
As a first shortcut, looking at the maps above:
Blue dot is the best, indicating High Water Quality (i.e. healthy, natural, low levels of chemicals as required for normal healthy growth)
Green dot is still OK, Good Water Quality (but some chemicals present)
Red dot is Low Water Quality (levels of chemical present are too high, above the EPA maximum recommended levels for healthy waters)
Maps are shown separately for Nitrogen (N) and for Phosphates (P). The more Blue dots (and fewer Red dots) the better for any river.
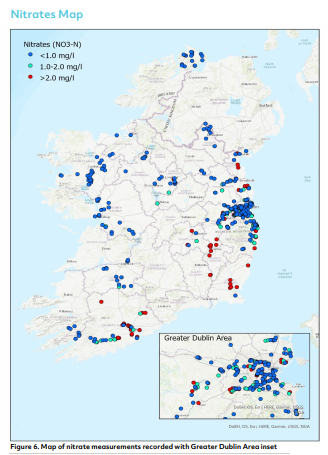
The Ireland Nitrogen map (above) shows a wide range of different water quality levels, with Red Dots (meaning Low Water Quality because of high Nitrogen pollution) at many points in the South East, East and South. As a contrast, the West shows a lot of Blue Dots (meaning High Water Quality, low Nitrogen pollution). See the full national report on the following link, or skip straight to the detail on the Dodder below.
Water Quality in the Dodder River System
Because Dodder Action and Dodder Volunteers were such a key part of the effort (this time and last time in 2019), the Water Institute provided us with a specific report of the data we collected on the Dodder. Highlights include:
a great level of volunteer coverage - 44 sample points up and down the Dodder system, including the Slang, Little Dargle, Owendoher, Jameston, Ballycullen, Whitestown and another 10 on our sister river the Poddle.
Overall Very Good Nitrogen Levels (first map) - Blue Dots showing High Quality (low nitrogen pollution) at most points. The exception was the Red Low Water Quality (high nitrogen pollution) indicated at some points around Tallaght
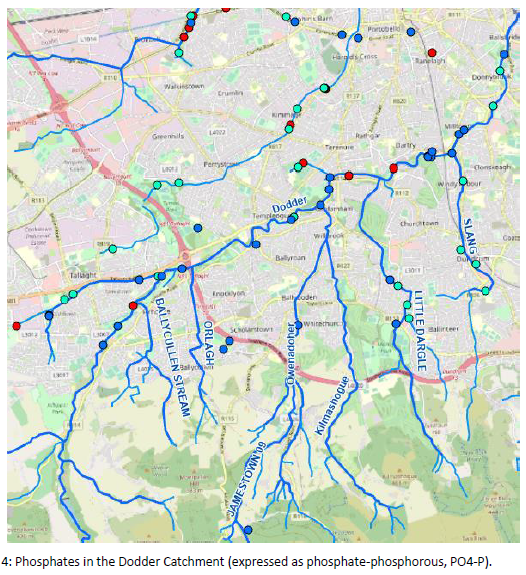
Overall Good but Mixed Phosphate Levels (second map) - Blue and Green Dots are good, but the Red dots in Tallaght, Terenure and the Poddle at Crumlin showing points that indicate high phosphate pollution
Read more in the River Dodder WaterBlitz Report.
We hope to follow up with DCU Water Institute and local authorities to further analyse and understand the results and what actions can be recommended and implemented to keep our River Dodder system as healthy and high quality as the community and the wildlife need it to be.
Thanks again to DCU Water Institute and especially our brilliant Citizen Science Volunteers, young and old.